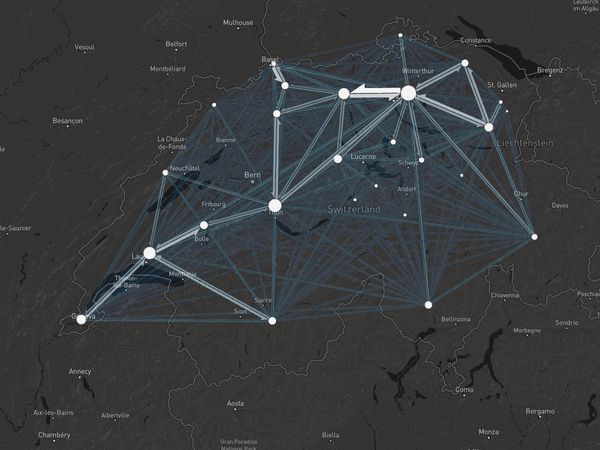
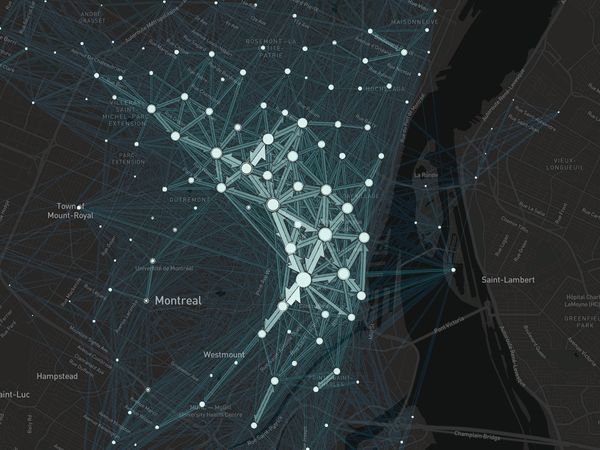
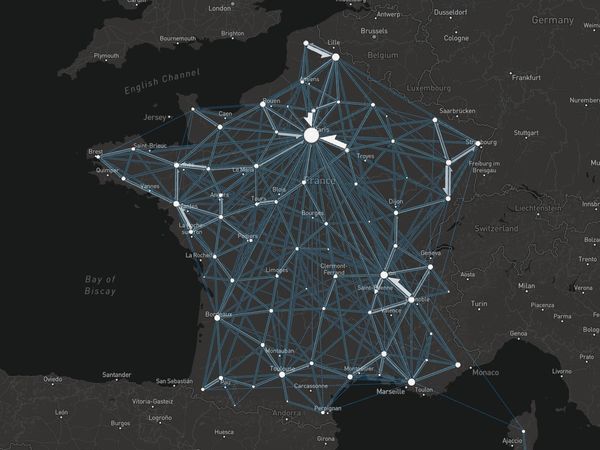
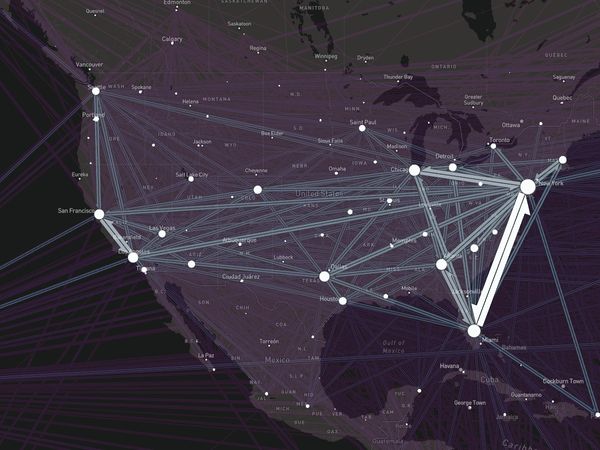
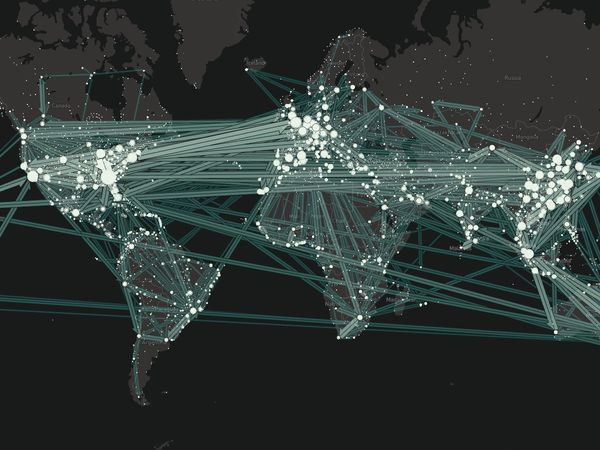
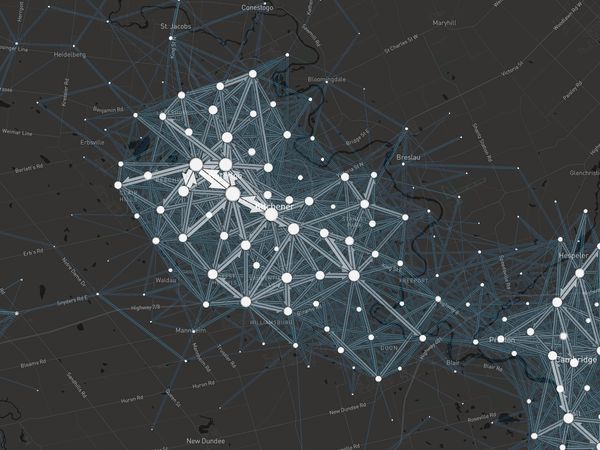
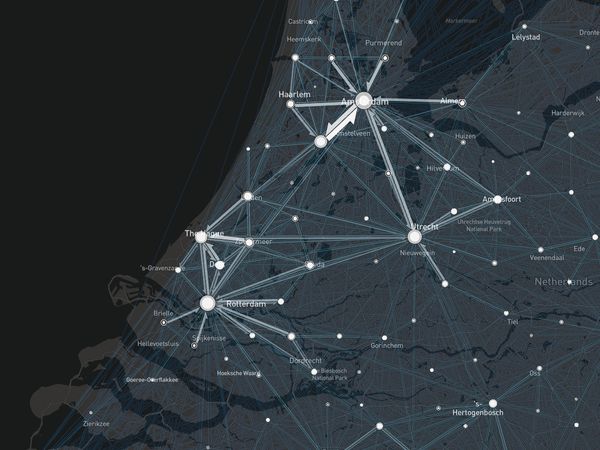
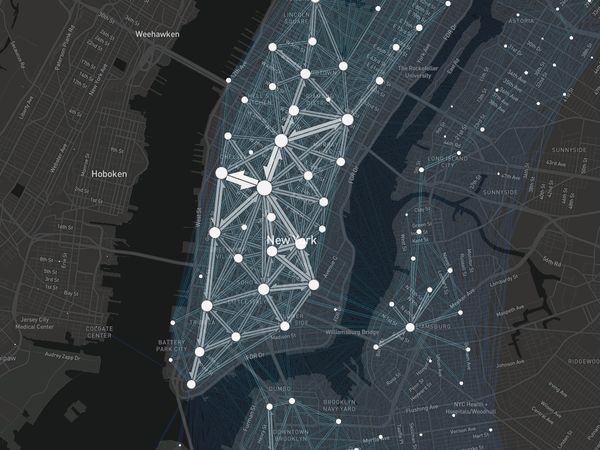
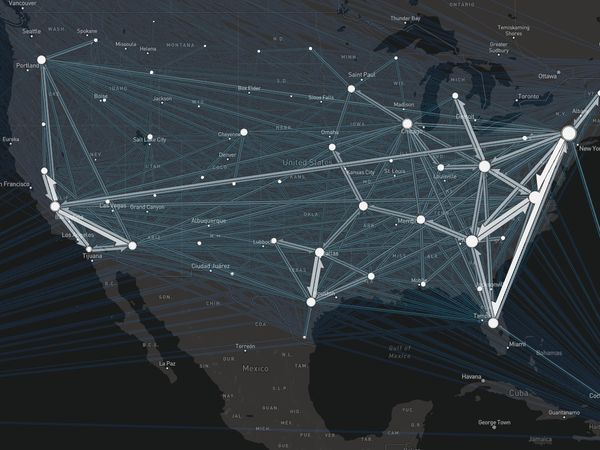
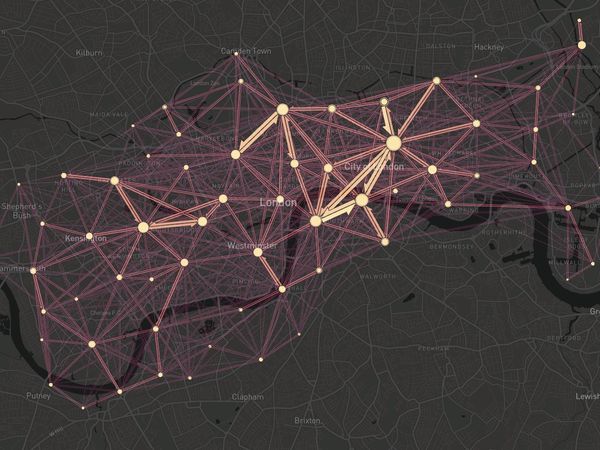
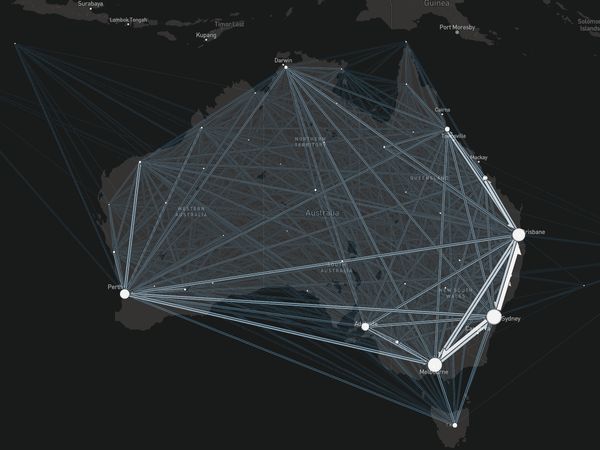
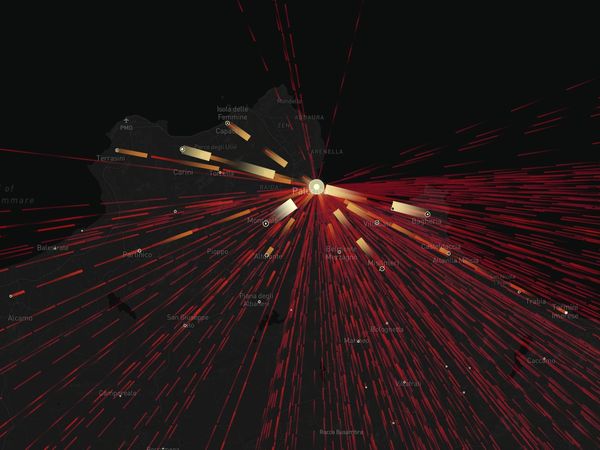
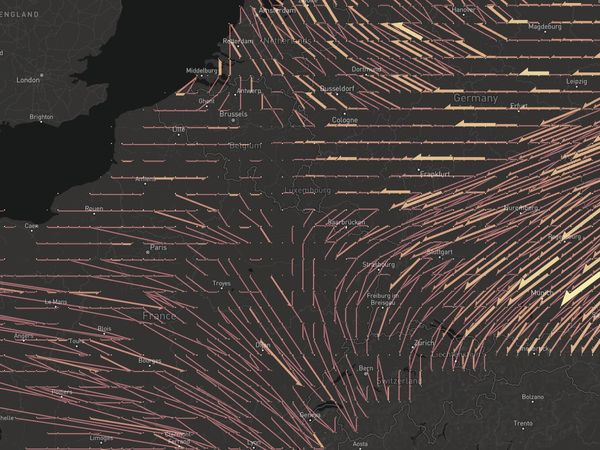
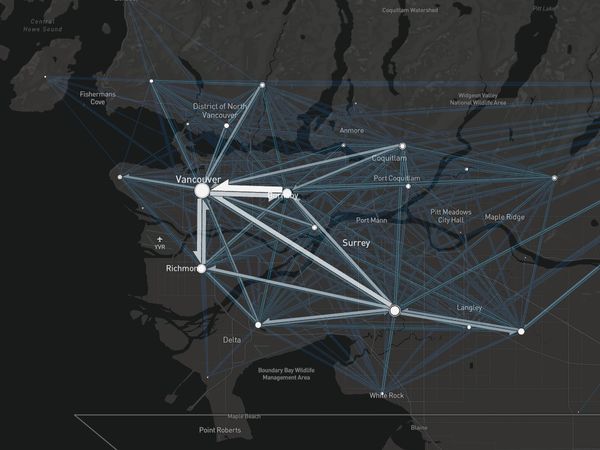
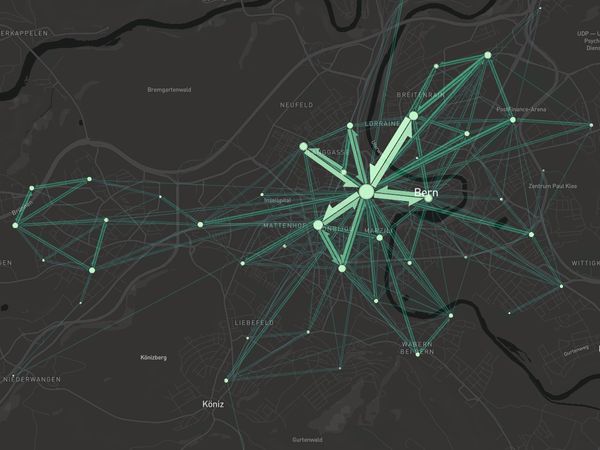
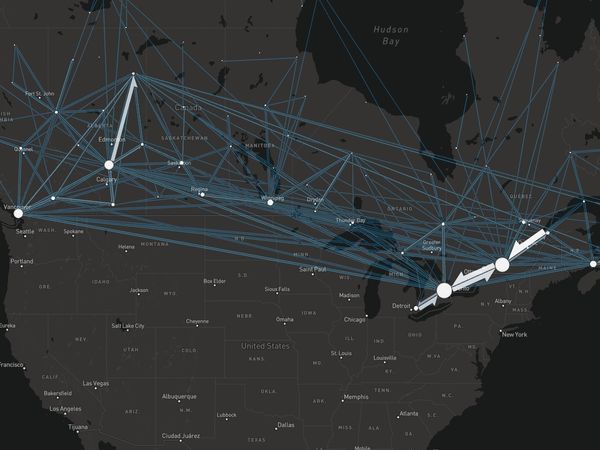
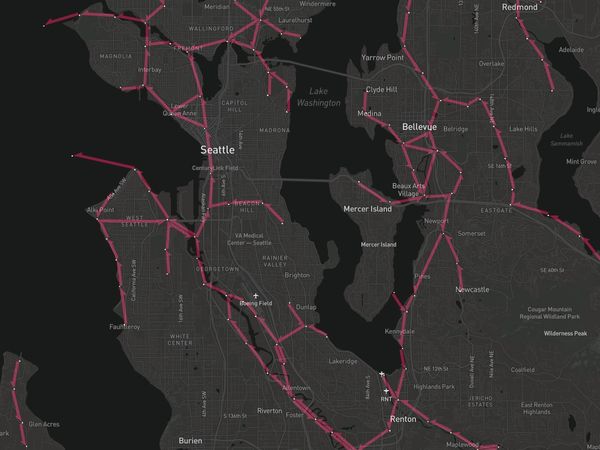
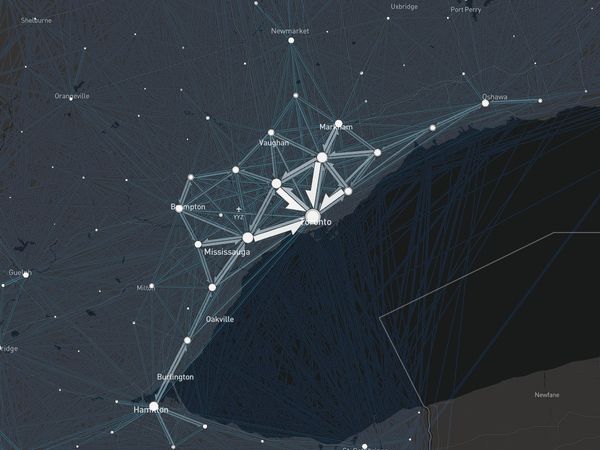
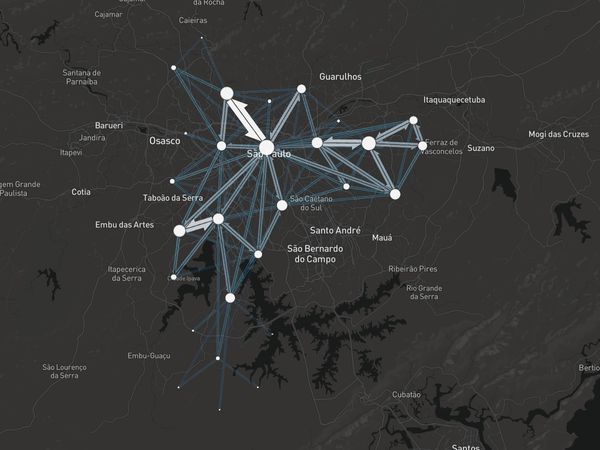
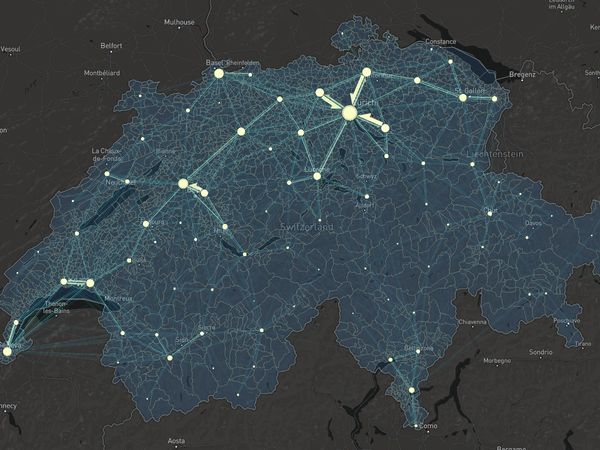
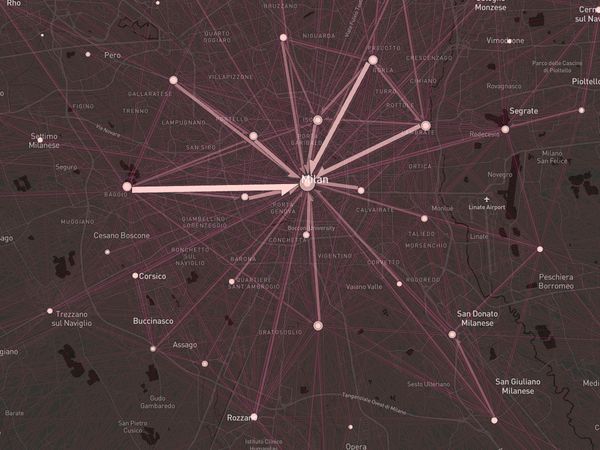
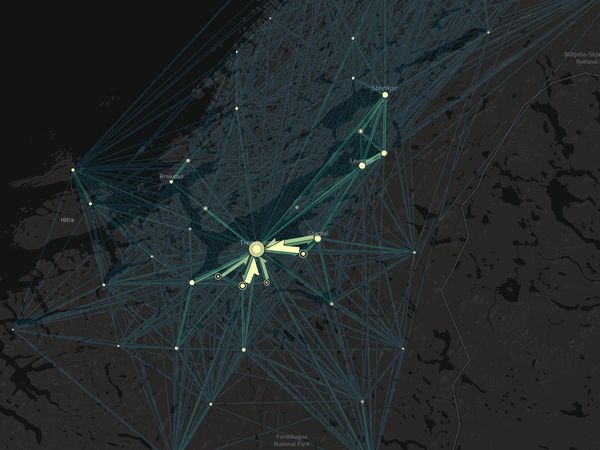
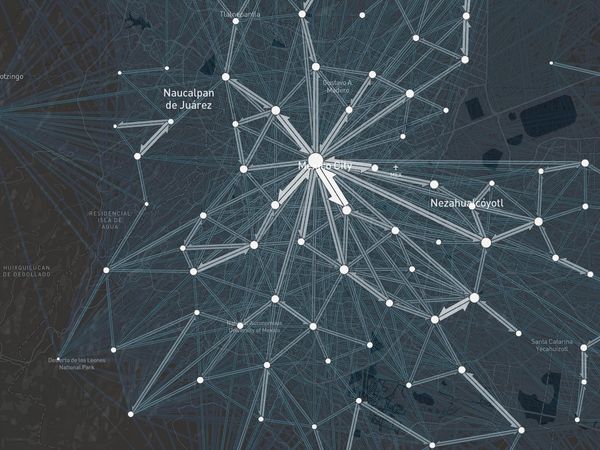
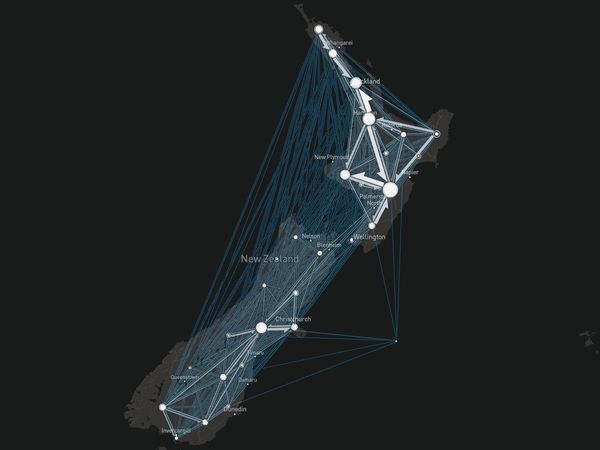
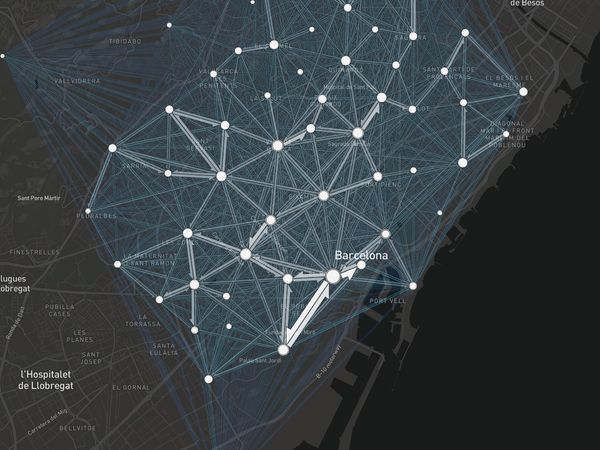
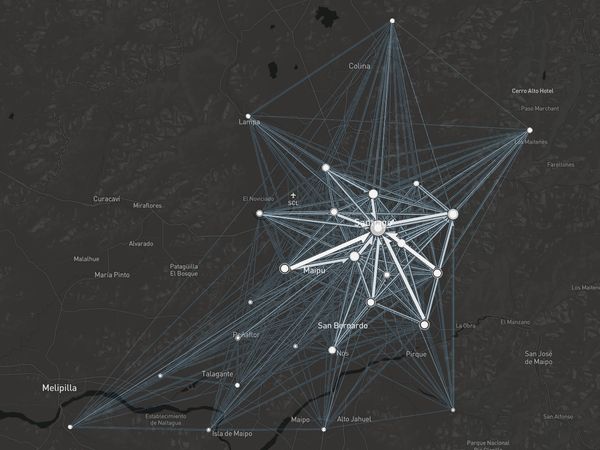
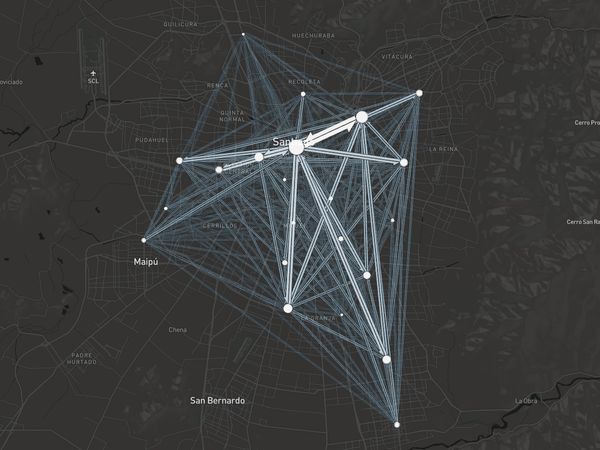
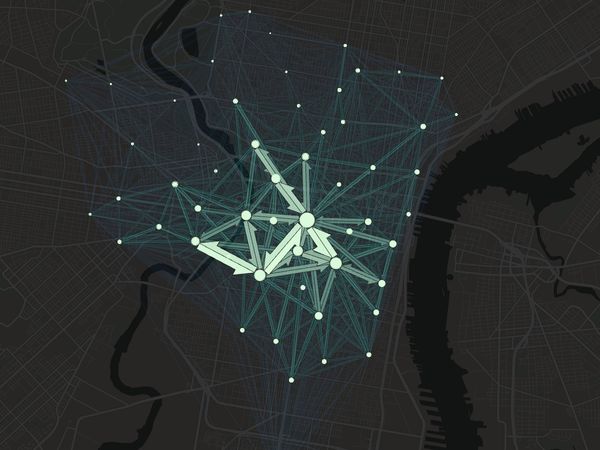
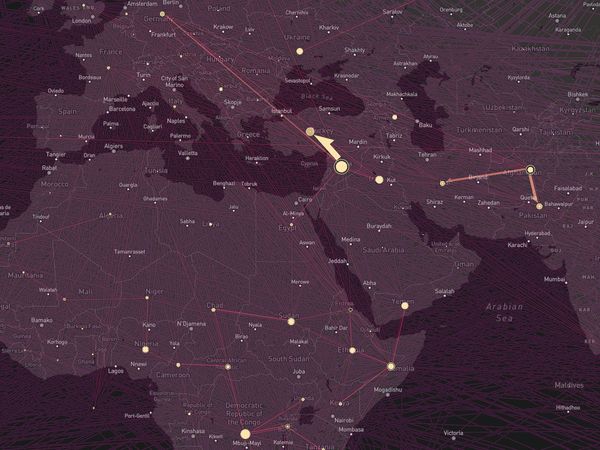
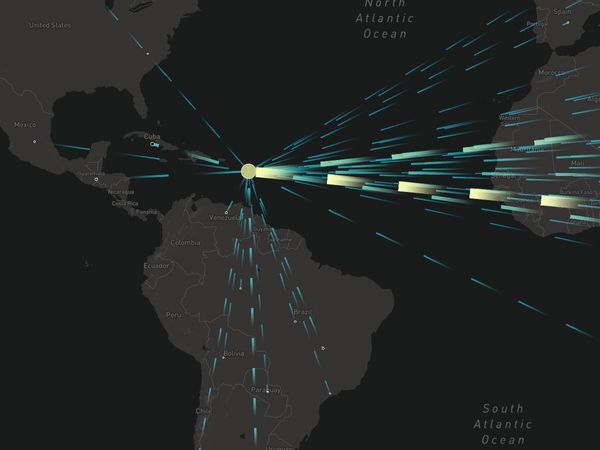
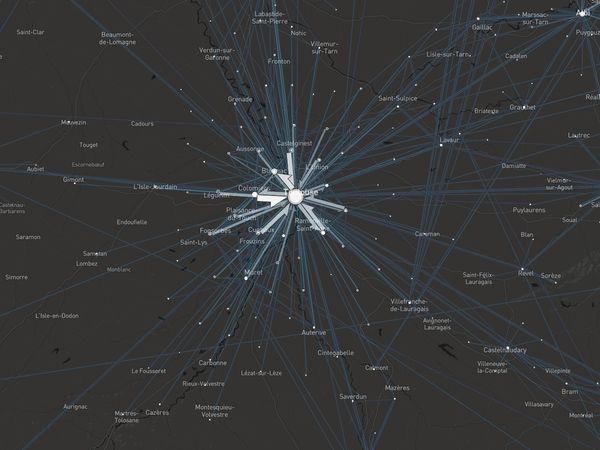
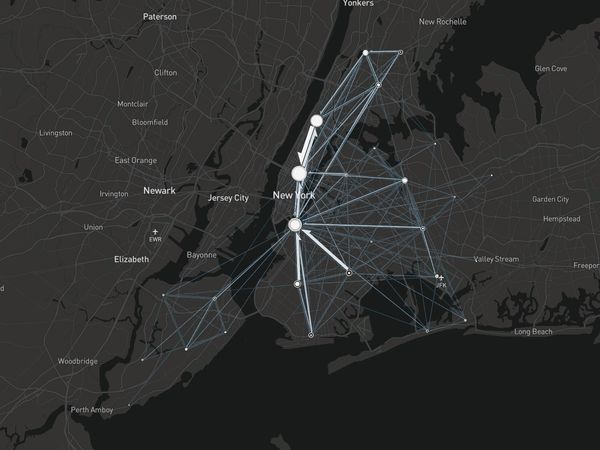
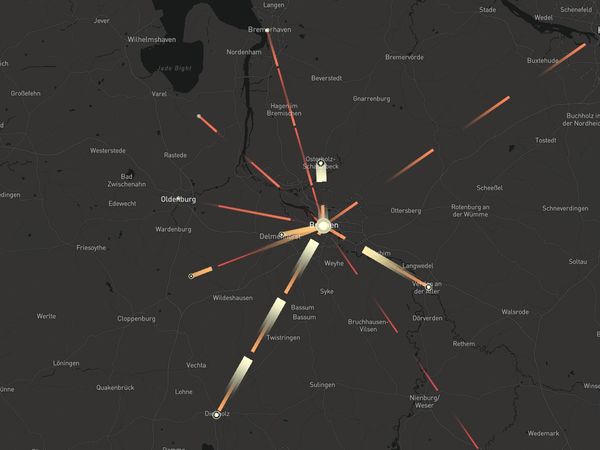
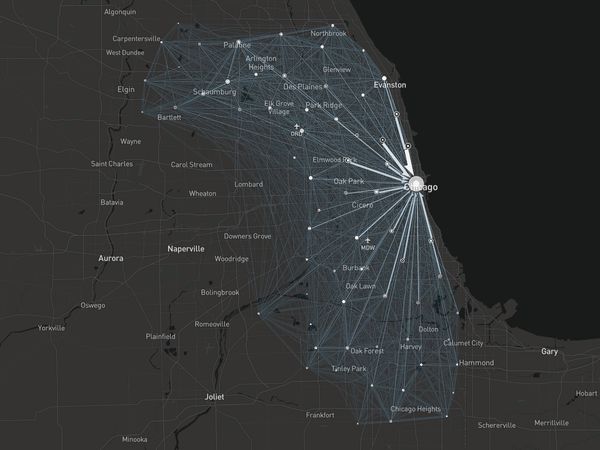
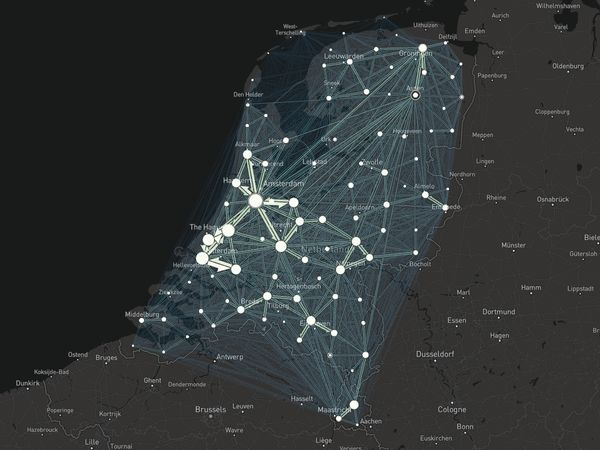
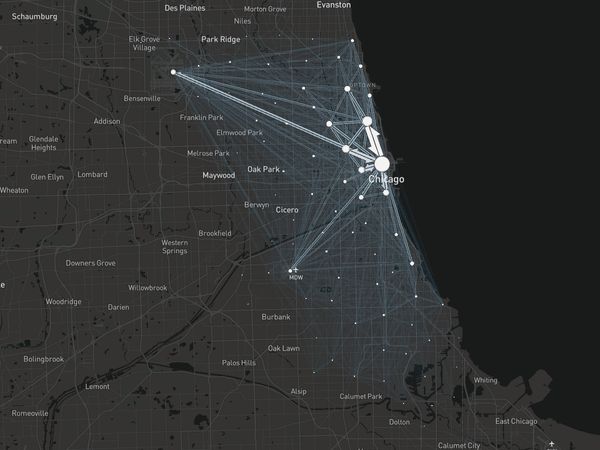
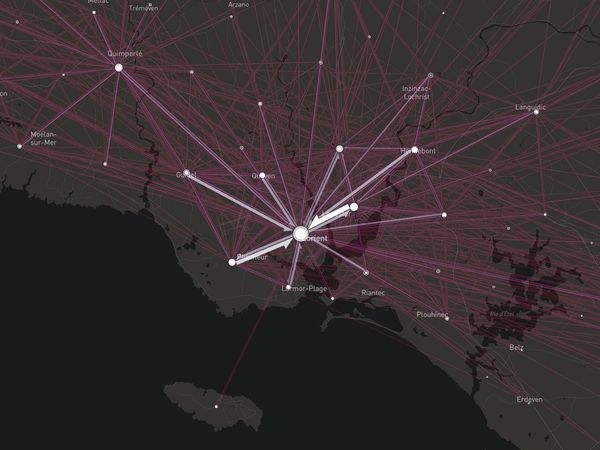
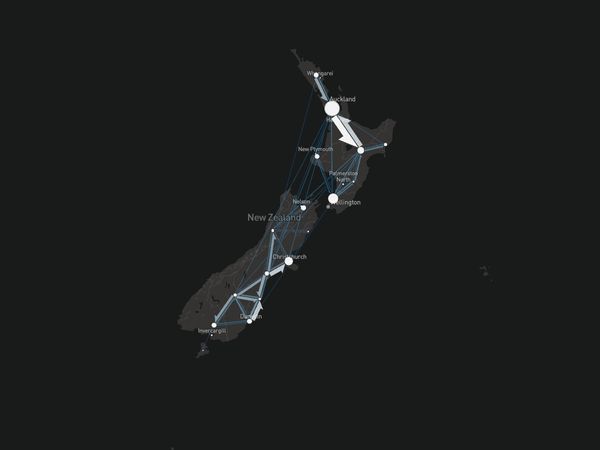
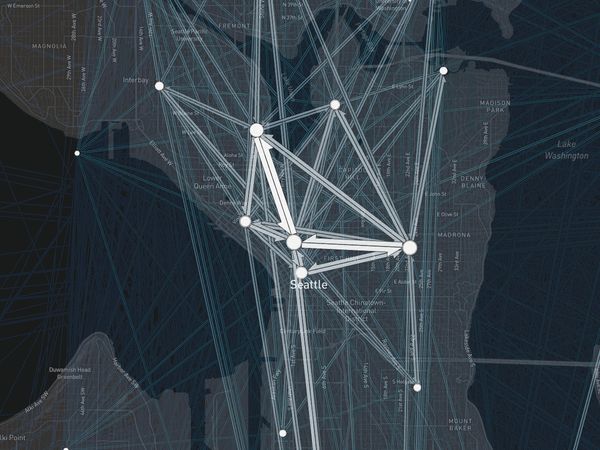
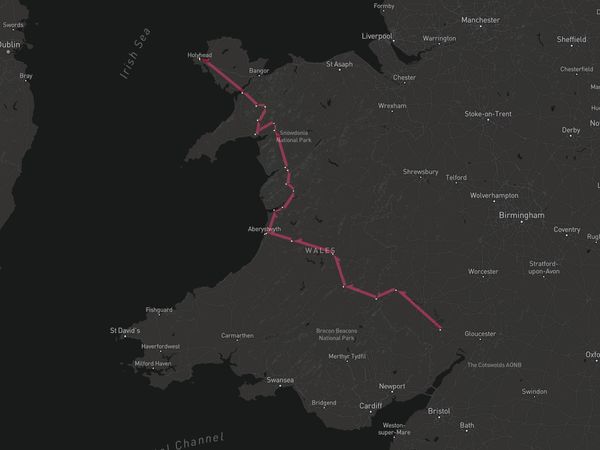
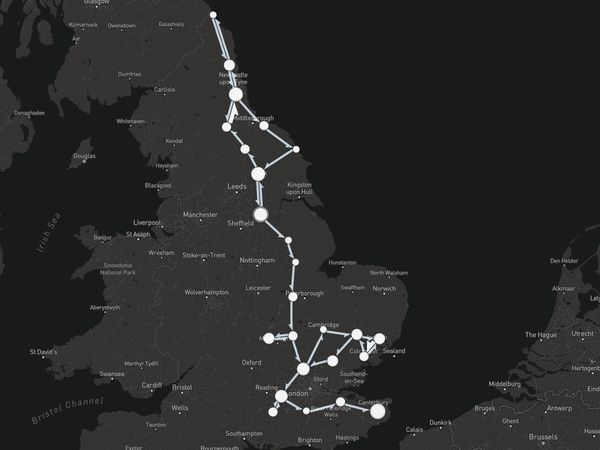
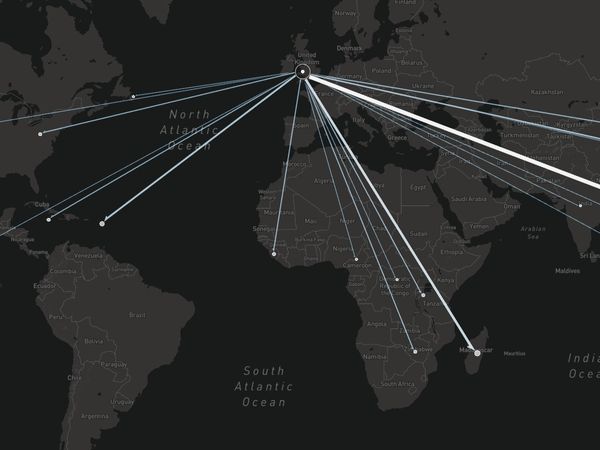
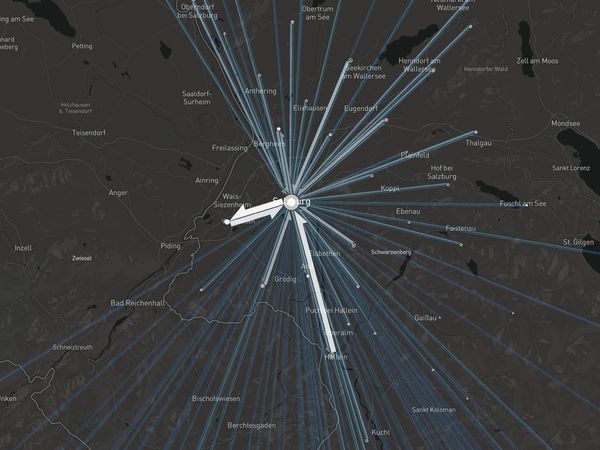
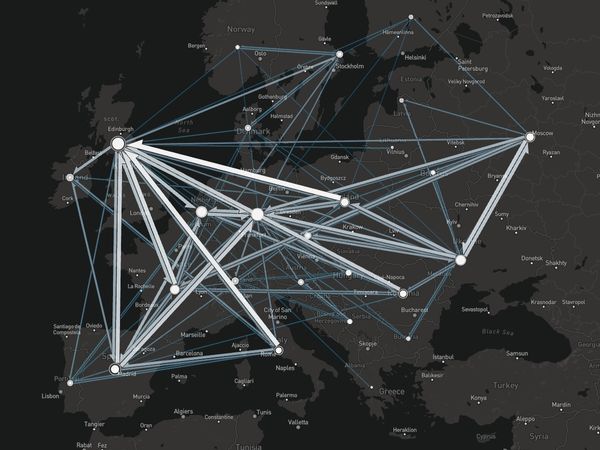
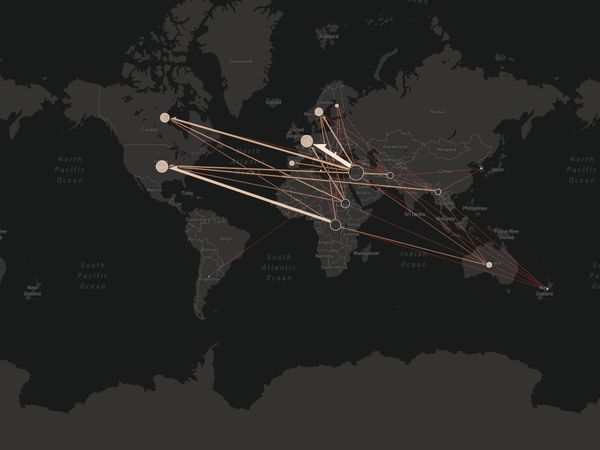
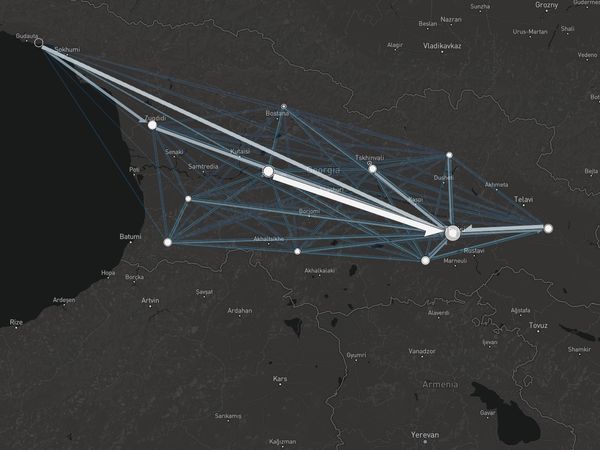
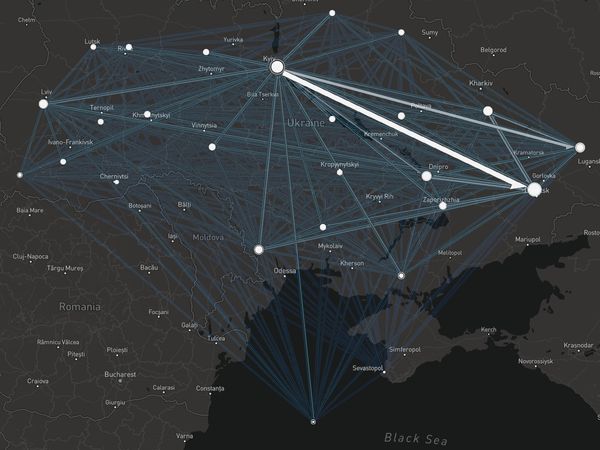
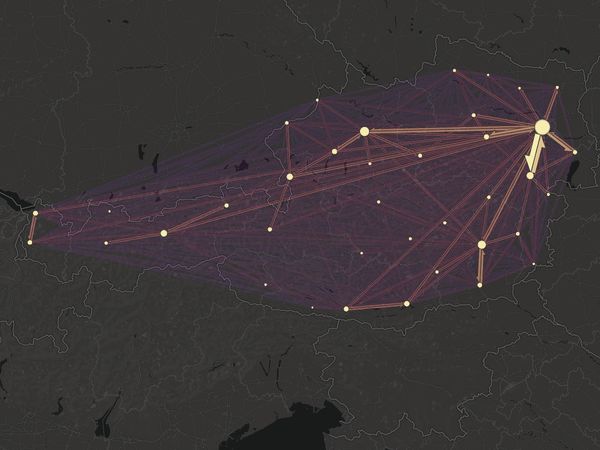
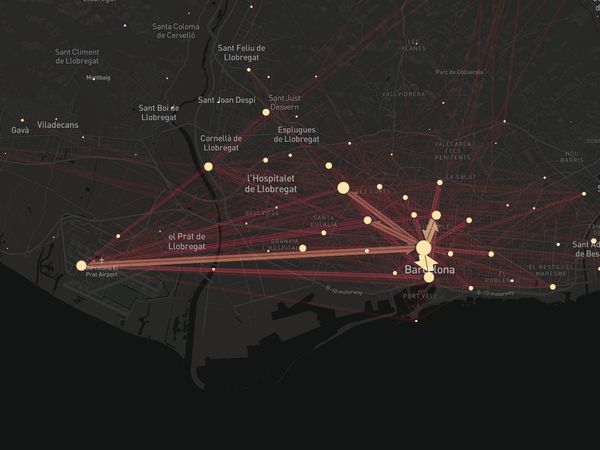
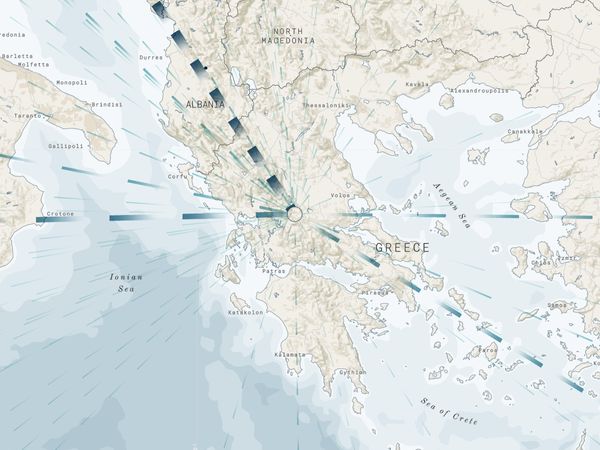
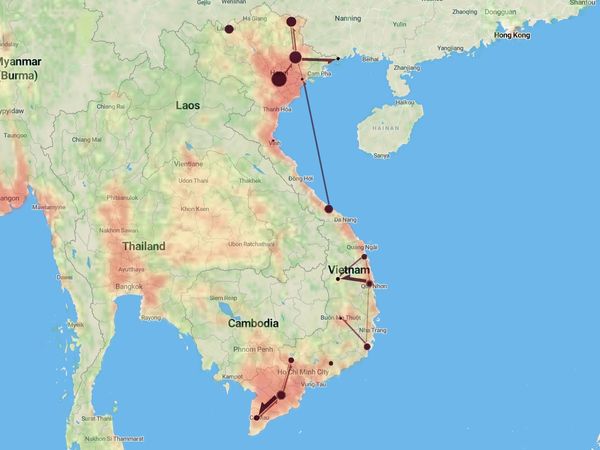
Create geographic flow maps representing your data published in Google Sheets.
Visualize numbers of movements between locations (origin-destination data).
Explore the data interactively.
How to visualize your data
To publish a data set you need to have a Google account. Sign up here if you don't.
Follow these steps:
- Open the template spreadsheet
- Make a copy of it (find “File” / “Make a copy…” in the menu)
- Add data to the new spreadsheet. Read more…
- Share the spreadsheet by going to “File” / “Share with others”, clicking “Advanced”, and then choosing “Anyone with the link can view”. Read more…
- Copy the link to your spreadsheet and paste it here:
Examples


News
Tools
Our Geocoding tool can help you finding the geographic coordinates for locations if you only have their names in your dataset.
Use the OD-matrix converter if your movement counts are represented as an OD-matrix.
With the In-browser flow map you can visualize OD-data directly in your browser without having to upload the data to Google Sheets.
Need help?
Ask a question in the forum, submit an issue or write me an email.
Data privacy
Flowmap.blue does not store any of the data the users upload to Google Sheets. The data from the spreadsheets is loaded directly into the clients' browsers. We are using Google Visualization API for that.
We treat the data as private, including the URLs of the spreadsheets and flow maps published by the users. We do not disclose the URLs without getting an explicit consent from the authors (unless the authors have already disclosed them by linking from a publicly accessible website).
We collect usage statistics via Google Analytics and track errors via Sentry. We want to know how Flowmap.blue is used and when it fails so that we can improve it. The use of Google Analytics involves setting cookies in the users' browsers for detecting recurring visits and working sessions.
We may try to contact you asking for a permission to add your flow map to the list of examples on the homepage of Flowmap.blue.
Open source
The source code of Flowmap.blue is freely available under the MIT license.
Make sure to include a proper attribution (URL of Flowmap.blue, the original author) if you use it in a different project.
Credits
Developed by Ilya Boyandin using flowmap.gl, deck.gl, mapbox, d3, blueprint, CARTOColors.
With kind support from![]() and
and![]()

Awards
